Growth / CRO / Analytics
95% of revenue from one device, and why
An MSc Marketing Practice module project analysing the Google Merchandise Store in GA4. Desktop and mobile brought almost identical traffic. Desktop produced 95.4% of the revenue. The whole analysis is about closing the gap between those two sentences.
- Role
- Analyst on the project team
- Timeline
- MSc Marketing Practice, University of Galway
- Scope
- Google Analytics 4Funnel analysisConversion rate optimisationRoadmap
- Users analysed in GA4
- 61,000+Users analysed in GA4
- Mobile checkout abandonment
- 70.3%Mobile checkout abandonment
- Of revenue from desktop
- 95.4%Of revenue from desktop
- Of users were returning customers
- 19%Of users were returning customers
At a glance
- Project
- MSc Marketing Practice module project: a conversion rate optimisation analysis of an ecommerce store with a mobile revenue leak.
- My role
- Analyst on the project team.
- Key outputs
- GA4 funnel analysis across 61,000+ users
- Mobile checkout abandonment diagnosis
- Retention gap analysis (19% returning vs 81% new)
- Prioritised CRO fix roadmap ordered by impact vs effort
- Primary result
- 70.3% mobile checkout abandonment identified
Tech stack
Tools used
 Google Analytics 4
01 · The picture
Same traffic, completely different outcome
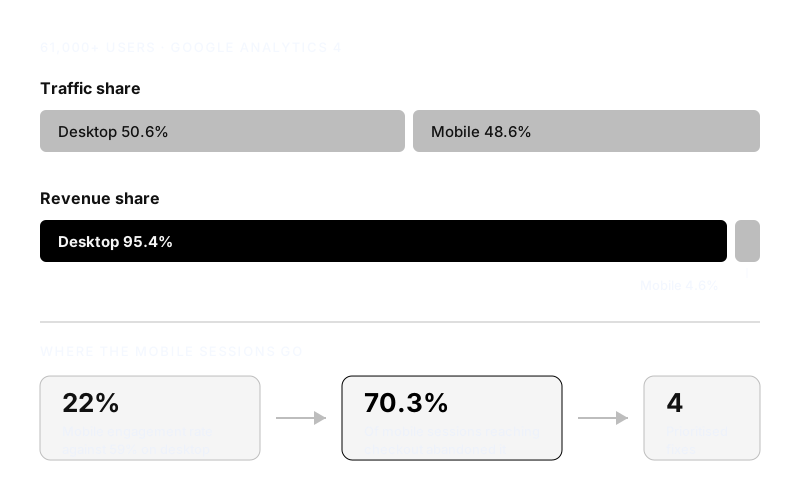
We split the work across the team: mobile performance, checkout drop-off, paid traffic ROI and returning-customer rate, each of us presenting a different piece of the same GA4 dataset. Across 61,000+ users, desktop and mobile split the traffic almost evenly: 50.6% against 48.6%. Revenue split 95.4% desktop against 4.6% mobile. Half the audience was arriving on a device that converted at a fraction of the rate, which is a revenue problem disguised as an audience report.
Traffic dashboards hide this, because by the metric most people look at first, mobile was doing fine. Engagement told a truer story: a 59% engagement rate and an average of 1m43s on desktop against 22% and 22 seconds on mobile.
02 · The mobile checkout
Following it down the funnel in GA4
Funnel exploration in GA4 put the loss in a specific place. Add-to-cart rate held up reasonably well on mobile (18.0% against desktop's 22.6%), but the gap widened at every step after: begin-checkout rate dropped to 29.7% on mobile against 54.4% on desktop, and only 86 mobile sessions completed a purchase against 795 on desktop. Checkout abandonment overall came in at 70.3% mobile against 45.6% desktop.
Journey testing on the mobile site turned that number into specific, fixable problems: a slow-loading cart page, a mandatory Google account login with no guest checkout, complex checkout forms requiring billing and shipping addresses entered separately, address autofill that fails on iPhone, only one payment option, and shipping restricted to the US and Canada with no notice given before checkout.
70.3%
Of mobile checkout sessions abandoned
03 · The retention gap
A store running almost entirely on first-time buyers
The second finding sat underneath the first: only 19% of users were returning customers, against 81% new. Returning users converted at more than double the rate of new users, 3.8% against 1.9%, but because there were so few of them, they generated only 28% of total revenue. High-intent customers existed. The store just was not built to keep them coming back.
That combination, low retention volume plus a materially higher conversion rate once retained, is what makes the fix worth prioritising: a loyalty programme with a points system and repeat-customer discounts, post-purchase email and remarketing automation, and targeted incentives such as limited-time offers and bundles aimed specifically at people who had already bought once.
04 · The output
A prioritised roadmap
The deliverable was a conversion rate optimisation (CRO) roadmap ordered by expected impact against effort, covering both leaks: simplify the mobile checkout to the smallest number of steps that still takes payment, introduce guest checkout so the account requirement stops killing first purchases, add mobile payment methods so nobody types a card number on a phone, and build the retention loop, loyalty, CRM automation and targeted remarketing, behind the customers who already convert best.
Prioritising is the part that makes an analysis usable. Anyone can produce twelve recommendations; the value is in saying which two to do first and what you expect to happen when you do.
05 · Tools & tech stack
What the work ran on
Analytics: Google Analytics 4, including funnel exploration, device and engagement reporting, and returning-customer analysis.
06 · What it produced
A revenue leak traced from a top-line report to two specific points in the customer journey, mobile checkout and retention, with a fix list ordered by what would move the number fastest.
- Users analysed
- 61,000+Users analysed
- Mobile checkout abandonment identified
- 70.3%Mobile checkout abandonment identified
- Returning against new users
- 19% vs 81%Returning against new users
- Prioritised fixes in the roadmap
- 4Prioritised fixes in the roadmap
Reflection
What I learned
Prioritising is what makes an analysis usable. Anyone can produce twelve recommendations. The value is in saying which two to do first and what you expect to happen when you do. The CRO roadmap I delivered was ordered by expected impact against effort, rather than by how interesting each finding was.